Due to increasing evidence regarding the discrepancy between suggested and observed levels of physical activity among adolescents, it is important to conduct high-quality studies that provide solutions to this issue. Schools are essential in shaping children’s lives, as they can reach almost all children. Thus, several programmes, including programmes that aim to promote more physical activity during school hours, have been implemented in Norwegian schools. Research has found that the implementations of these programmes are often unsuccessful due to a lack of competence among the implementers, that there are outcome differences between genders and ages, as girls are less active than boys, and activity levels decline with age (Gustavsen & Strømsvik, 2018). This research indicates that the solution to promoting more physical activity does not involve simply adding new elements to existing programmes (Wake, 2018); rather, programmes may need to be designed differently to promote a long-term, healthy and active lifestyle among children. A recent report demonstrates that physical education (PE) in Norwegian secondary schools is not beneficial for all students, as both the content and teaching methods lack variation (Moen, Westlie, Bjørke, & Brattli, 2018). This may mean that PE teachers must vary the content and methods and not just implement programmes in their quest to motivate students to participate in PE and physical activity.
This study was part of a larger research project, the goal of which was to investigate how the flipped learning (FL) teaching method affected adolescents’ motivation to participate in and learn from PE. The purpose of this specific study was to examine how the costs perceived by adolescents in attending PE affected their motivation to participate. The expectancy-value theory (Eccles, 1983) served as the theoretical framework of the study, as this theory was considered an important theoretical lens through which to examine and understand students’ motivation to participate in and learn from PE (Gao, 2009; Zhu, Sun, Chen, & Ennis, 2012).
Theoretical Framework
Flipped Learning
Flipped learning is a pedagogical approach in which direct instruction moves from the group to the individual learning space, and the resulting group space is transformed into a dynamic, interactive learning environment in which the educator guides students as they apply concepts and creatively engage with the subject matter (Flipped Learning Network [FLN], 2014). A review of the literature shows that FL can improve students’ academic achievement, satisfaction, engagement, promote self-paced learning and increase interactions between students and teachers (Akçayır & Akçayır, 2018; L. L. Chen, 2016). The definition of FL is conceptualized from the method originating in theory-dominated subjects like mathematics and science, rather that more practical subjects than PE.
For the purpose of this study a flipped class in PE was planned and conducted as following: the students prepare for class at home by watching a video about the topic that will be covered during the next class. The topic is endurance training, and the video consists of the teacher explaining and demonstrating the subject. The teacher also explains what physiological changes occur when one´s endurance is increased and the effect this has on one’s health. Finally, the teacher explains the content of the next class. After the video, the students are prompted to answer quiz questions. Thus, when the students come to class, they know what to do, and they can start activities without the teacher having to explain in detail about the class content. During the lesson, the students discuss the content of the video among themselves and with the teacher. The teacher concludes the class by having the students explain the key topics of the lesson. In comparison, a traditional learning environment in PE is dominated by an instruction-conduction practice where the teacher demonstrates what students should do. Internationally, a “…teacher-centered teaching style continues to dominate the practice of PE teachers despite the emphasis on ‘pupil-centered’ approaches…”(Green, 2008, p. 221), and similar patterns are found in Norway (Moen et al., 2018). As no other study describes what an FL learning environment would look like in PE, this was the basis on which this study’s intervention was conducted. This is further explained in the method section and possible biases are highlighted in the strengths and limitations section.
FL has a positive effect on adolescents’ motivation to participate in PE, as the expectation for success and attainment value increases in FL contexts, especially among girls (Østerlie, 2018). Moreover, FL has been used in PE to help students learn the rules of new games (Bergmann & Sams, 2014). Several studies suggest that FL is beneficial in PE, as it allows for more time to be dedicated to practical activities and individual feedback than traditional learning (Killian, Trendowski, & Woods, 2016; Lina, 2017; Østerlie, 2016). In secondary schools, FL has a positive effect on individualization in PE when it is used to help students learn skills in orientation activities (García, Castro, & Morales, 2015). In universities, FL enriches the teaching resources of sports courses and enhances the students’ interest in learning, which results in significant improvements in the their ability to engage in self-study of the PE curriculum (Bing, 2017).
The concept of FL in PE is to organize the learning to obtain more time for practical activity, and arrange for more learning, both physically and cognitively, by the students in their preparation prior to class. This preparation, preferably a video, needs to be specific to the upcoming class by including both practical information about the activities and theoretical knowledge underpinning the topic. One challenge in this method is ensuring that all students prepare at home, as there are reports that some students are not satisfied with the extra work-load which the method entails (Missildine, Fountain, Summers, & Gosselin, 2013). Nevertheless, the observed challenges are far less than the observed advantages (Akçayır & Akçayır, 2018).
Expectancy-value Theory
In educational research, expectancy beliefs and task values are considered important predictors of students’ academic performance and behaviour choices (Eccles, 1983; Eccles & Wigfield, 1995). Moreover, students’ achievement-related choices and performance in a domain are directly influenced by their expectancy beliefs and task values (Eccles, 1983; Eccles & Wigfield, 2002; Wigfield & Eccles, 2000). Expectancy beliefs refer to one’s broad beliefs about one’s competence in a given domain (Zhu et al., 2012). The expectancy for success is defined as one’s beliefs regarding how well one will perform a given task. This expectancy is independent of the motivational factor known as subjective task-value (Eccles & Wigfield, 1995). Research has found that the expectancy for success is associated with students’ performance, engagement and intention to participate in PE (Xiang, McBride, & Bruene, 2004; 2006) but not necessarily with learning achievement in it (Zhu & Chen, 2010). According to Eccles (1983), there are four task values attached to a certain domain: (a) attainment value, (b) intrinsic value, (c) utility value and (d) costs.
Researchers have theorized that costs, which refer to the negative aspects of engaging in a task, such as the fear of failure or lost opportunities due to choosing one task over another (Wigfield, 1994), negatively affect students’ achievement behaviour (Eccles, 1983). This means that expectancy beliefs can motivate students to participate in PE, while costs can demotivate students. Several studies suggest that the way in which costs affect motivation should not be overlooked when examining students’ expectancy-value beliefs in PE (Gao, 2009; Gao, Lee, & Harrison, 2008). However, the subject of costs has been largely absent in most studies of expectancy beliefs and task values. Although the topic of costs is often included in the theoretical articulation of many studies (e.g. Wigfield, 1994; Xiang, McBride, Guan, & Solmon, 2003), it is rarely measured in studies regarding PE (A. Chen, Martin, Ennis, & Sun, 2008).
In a study of PE in elementary schools, which included 298 third to fifth grade students in the U.S., 69% of the students reported that certain costs could affect their motivation to participate in PE. These costs were identified as originating from four sources: content (68%), peer behaviour (14%), physical discomfort (12%) and teacher behaviour (6%) (A. Chen et al., 2008). Similar results have been found among older students: 70.3% of 593 middle-school students who reported on the costs of attending PE identified curriculum content as the major source of cost (Zhu & Chen, 2013), in common with their younger peers. This construction of perceived costs is similar to that of a group of Chinese college students, who credited as much as 45% of perceived costs to the content of the PE curriculum (A. Chen & Liu, 2009). Nevertheless, all the aforementioned studies revealed that most students, ranging from 84%–100%, would choose to attend PE if given the choice, despite the costs they perceived in attending.
The lack of evidence regarding the role of costs in the motivation process may hinder our understanding of the full function of expectancy beliefs and perceived task values in PE. Gao (2009) supports this view and calls for further investigation due to inconclusive findings. Because of the limited amount of research conducted on the cost aspects of the expectancy-value motivation in PE, I turn to related research that examines the motivation to participate in PE and the levels of enjoyment of participating in it. The following section conceptualises these aspects.
Physical Education
Contrary to the intentions of the Norwegian PE curriculum, student motivation to participate in PE declines with age (Säfvenbom, Haugen, & Bulie, 2014); this reflects the global trend (Gao et al., 2008). This decline is greater for adolescents than for young children (Fredricks & Eccles, 2002) and is greater among girls than boys (Säfvenbom et al., 2014; Thomas, Lee, & Thomas, 2008). This loss of motivation, especially among girls, is partly the result of a “sportified” PE curriculum (Ennis, 1999; Lundvall, 2016; Säfvenbom et al., 2014; Vlieghe, 2013). Nevertheless, studies show that PE is one of the best-liked subjects in compulsory school both in Norway (Moen et al., 2018) and internationally (Goodlad, 2004). Moreover, Moen et al. (2018) reported that in Norway boys tended to like PE more than girls did, as the number of students who reported liking PE “well” or “very well” was 92.3% for boys versus 84.8% for girls. This report also revealed that the number of students who liked PE “very well” declined significantly from fifth grade to tenth grade, with the rate of decline for girls being twice that of boys.
Lagestad (2017) shows that boys receive significantly better marks than girls overall in upper secondary-school PE and that more boys than girls receive the very top marks. These patterns appear in every type of class, independent of study programme and gender composition. This is echoed in the final marks of secondary students in 2017, as boys scored on average 4.7, and girls 4.5, which made PE the only subject in compulsory school in which boys performed better than girls (Statistics Norway, 2017). Compared with 2016, the difference increased from 0.1 to 0.2 between the two genders, so that the gender difference in PE only increased. Green (2008, p. 152) concludes that PE remains gendered in terms of organization, content and delivery, and that: “The tendency for PE to reinforce more than challenge hierarchical relations between the sexes remains.”
Studies have shown a relative age effect in PE that is similar to that found in youth sports (Aune, Pedersen, Ingvaldsen, & Dalen, 2017), and moreover revealed that boys value sports more than PE and girls conversely value PE more than sports (Kjønniksen, Fjørtoft, & Wold, 2009). As motivation to participate in physical activity outside school is highly linked to motivation to participate in PE during school (Shen, 2014), especially among girls (Kjønniksen et al., 2009), it is important to maintain students’ high motivation to participate in PE. Moen et al. (2018) found that the amount of involvement in sports by students, especially girls, outside school was strongly linked to how well they liked PE. Some studies argue that the PE curriculum is too narrow, as it does not include enhancing students’ social and cognitive skills, nor does it ensure that students have a positive perception of their physical self-worth; rather, the PE curriculum only comprises sports-like activities and workouts aiming at target heartrates and burning calories (Dyson, 2014; Ennis, 2011). This trend is also echoed in Norway, where ball and fitness activities conducted in an instruction-conduction teaching manner predominate secondary-school PE (Moen et al., 2018).
Recent activist research shows that adolescents tend to experience less costs in attending PE when more information about class content is provided and when they are included in the process of creating the curriculum. Students who disliked PE prior to the teaching period, especially girls, display the greatest improvement in terms of meaningfulness (Walseth, Engebretsen, & Elvebakk, 2018).
There is broad agreement in Norway and internationally, that PE favours boys and those who participate in sports outside of school (Andrews & Johansen, 2005; Dowling, 2016; Oliver & Kirk, 2015; Scraton, 2013; Säfvenbom et al., 2014). Thus, PE does not fully achieve its main aim, which is to motivate all children and adolescents to have a lifelong, healthy and physically active lifestyle (Kirk, 2010). New pedagogical approaches in PE should be adopted, as the subject remains dominated by a traditional instruction-conduction agenda and a limited range of activities.
Research Question
This study aims to determine whether the use of FL affects students’ motivation to participate in PE based on the costs they perceive in attending PE lessons. From this, two research questions have emerged:
RQ1: Can flipped learning decrease the costs that students perceive of participating in PE?
RQ2: Can flipped learning positively affect students’ intentions to participate in PE?
Methods
Research Design
The study was conducted over a period of three weeks during the spring of 2016. Three learning resources regarding endurance, strength and coordination were used. Each resource consisted of a video that was assigned for viewing as homework before class, one in-class lesson plan that the PE teacher followed, and a teacher’s guide. The videos were about 12 minutes long, which was well within the suggested length for such videos (Long, Logan, & Waugh, 2016), and were published on a digital learning platform. Each video gave a thorough but easily understandable introduction to the in-class content topic. For example, when endurance was the weekly topic, the video explained endurance in an age-appropriate way by discussing why endurance improves health, what happens in the body when endurance is gained and how to increase endurance. At the end of the video, a summary of the upcoming class content was given. Short quizzes embedded in the videos were used to enhance the students’ motivation to continue watching and to develop a deeper understanding of the content, as suggested by Long et al. (2016) and Frydenberg (2012).
The participating classes were randomly divided into two different categories. The intervention group (n = 141) had access to the videos as homework before coming to class. The control group (n = 197) conducted the same practical classes as the intervention group but were not granted access to the videos. To represent as closely as possible the conventional methods of conducting PE classes in Norway, some of the control groups received a short summary of what was explained in the videos that the intervention group watched as homework. This summary was delivered orally by the PE teacher at the beginning of each PE class, and this presentation typically lasted about five minutes. Some of the control groups only went through the practical class and were given no oral explanation of the topic. Both the intervention and control groups underwent the same practical activities in class, and all the participating teachers managed both the classes that belonged to the intervention group and the control group. This ensured that the only difference between the two groups was that the intervention group was given access to the pre-class preparation videos. The connection between the video content and the content of the in-class activities is often overlooked, but it is essential to success in an FL environment (Long et al., 2016), so the videos and the lesson plan were produced by the researcher and not each individual teacher.
Before the intervention began (Time 1; T1) and when the intervention concluded (Time 2; T2), the students’ perceptions of the costs of participating in PE were measured using four open-ended questions from the Expectancy-value Questionnaire (EVQ). To ensure the students’ anonymity the teachers collected the questionnaires, including the self-reported information on gender, date of birth and name, and mailed these in closed envelopes to the researcher. Before analysing the data, student names were coded, and the names removed. The study was reported to the Norwegian Centre for Research Data (Project #47604).
Participants
Norwegian students (N = 338; 92.9% of the 364 invited) from six different secondary and upper secondary schools were included in this study. The selected schools represented both rural and urban communities with a normal distribution of immigration and social statuses. Self-reported information on gender, date of birth and name were obtained to characterize the sample. The girls (n = 153) had a mean age of 15.26 years (SD = 1.3), and the boys (n = 185) 15.01 years (SD = 1.12). The participants were from four different levels in the Norwegian school system, which were the three years in lower secondary school and the first year of upper secondary school: Year 8 (n = 14), Year 9 (n = 101), Year 10 (n = 38) and upper secondary level 1 (VG1) (n = 85). The students’ average school marks in PE (girls: 4.45 and boys: 4.48) for the same semester also reflected the national average for Year 10 (girls: 4.5 and boys: 4.6) (Statistics Norway, 2016). The data were collected during the spring of 2016.
Variables and Measures
Cost constructs. Motivational cost has been under-researched, and there are no specific quantitative tools to measure it (Zhu & Chen, 2013). For this study, four open-ended questions were used, as was done in Chen and Liu (2009) and Zhu and Chen (2013), to measure the cost of attending PE. The four questions were consolidated into the following two questions: “If there is anything that you do not like in PE, what would that be? Why?” (Question 1 [Q1]) and “If you had a choice, would you rather not come to PE? Why?” (Question 2 [Q2]). Q1 addressed what aspects of PE the students did not like and thus identified the costs of attending PE. Q2 revealed whether students experienced opportunity cost by attending PE because PE was a mandatory subject, and the students were asked a hypothetical question regarding if they would or would not attend PE if the subject was not mandatory. Two hundred and fifty-four (out of 338: 75.1%) students provided legible responses to Q1, and 291 (out of 338: 86.1%) provided legible responses to Q2. One hundred and eighty-two (out of 338: 53.8%) of the students provided legible responses to both open-ended questions at T1 and T2, so these responses were included in the repeated-measures analysis. The results of an ANOVA test and a Bonferroni post-hoc test showed no significant difference in expectancy beliefs (p>.167) nor task value (p>.358) between those who provided responses to the open-ended questions and those who did not. These two constructs were derived from the EVQ.
Data Collection
The PE teachers collected the self-reporting questionnaires in accordance with the instructions of the research leader.
Data Reduction
The open-ended questions regarding costs were reduced, based on a modified version of the categorization in Zhu and Chen (2013) and Chen and Liu (2009), to the following categories and sub-categories: Q1: If there is anything that you do not like in PE, what would that be? Why? (1) no cost, (2) perceived costs (curriculum content, instructional conditions/elements, lack of social support/competence, physical discomfort, teacher factor); Q2: If you had a choice, would you rather not come to PE? Why? (1) attend PE (attend PE with no reason, academic requirement, motivation, benefits of physical activity in PE), (2) not attend PE (not attend PE with no reason, enough physical activity, curriculum content difficult/boring/not useful, instructional conditions, academic conditions/opportunity cost) and (3) it depends/not sure. The assessment of the students’ self-reported answers suggested that these categories covered all the answers, but the category of not attending PE because of “academic conditions” was added because several students responded with “I would focus on other subjects” and “My grade in PE lowered my overall average grade, so I would not choose it.” The original category of “Do not like the teacher” was removed, as none of the students’ responses fit that category. See Appendix A for a survey of the cost categories, sample student responses and codes.
Data Analysis
Students’ responses to the open-ended questions were analysed using an open-coding approach to analysing a whole sentence or paragraph, which was especially useful when the researcher already had several categories and wanted to code specifically in relation to those categories (Strauss & Corbin, 1998).
Analyses of the coded, open-ended questions were conducted with Friedman’s test, as non-parametric distributions across the two test attempts were examined. A Pearson correlation coefficient was computed to assess the relationship between perceived costs and age, and a chi-square test was used to determine whether there was an association between Q1 and Q2. A significance level of 95% was used.
Results
Based on the data analyses, the results from T1 and T2 are presented for both the intervention group and the control group and between genders in the intervention group. Table 1 presents the results of Q1.
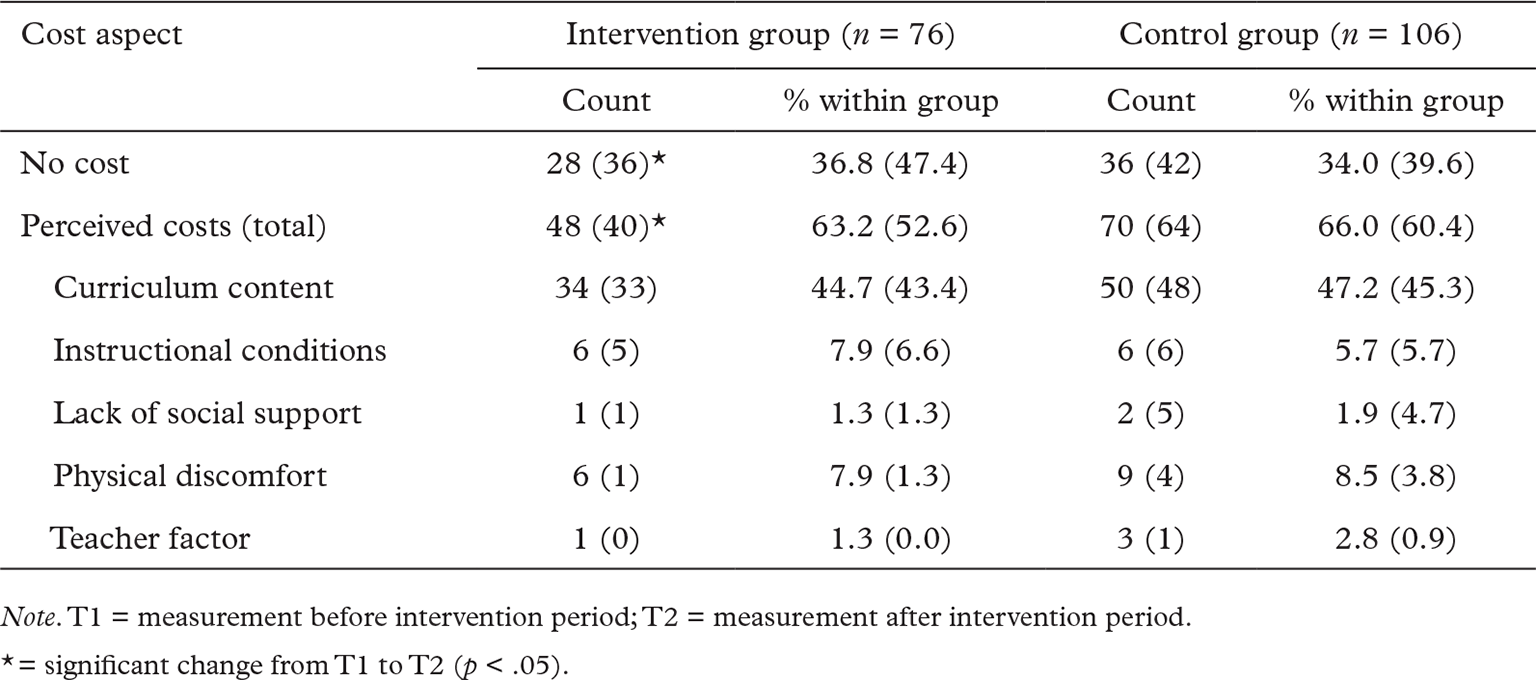
The Friedman’s test indicated that the intervention group (χ2(1) = 4.00, p = .046) and the control group (χ2(1) = 1.636, p = .201) rated Q1 differently from T1 to T2. The gender differences within the intervention group are presented in Table 2.
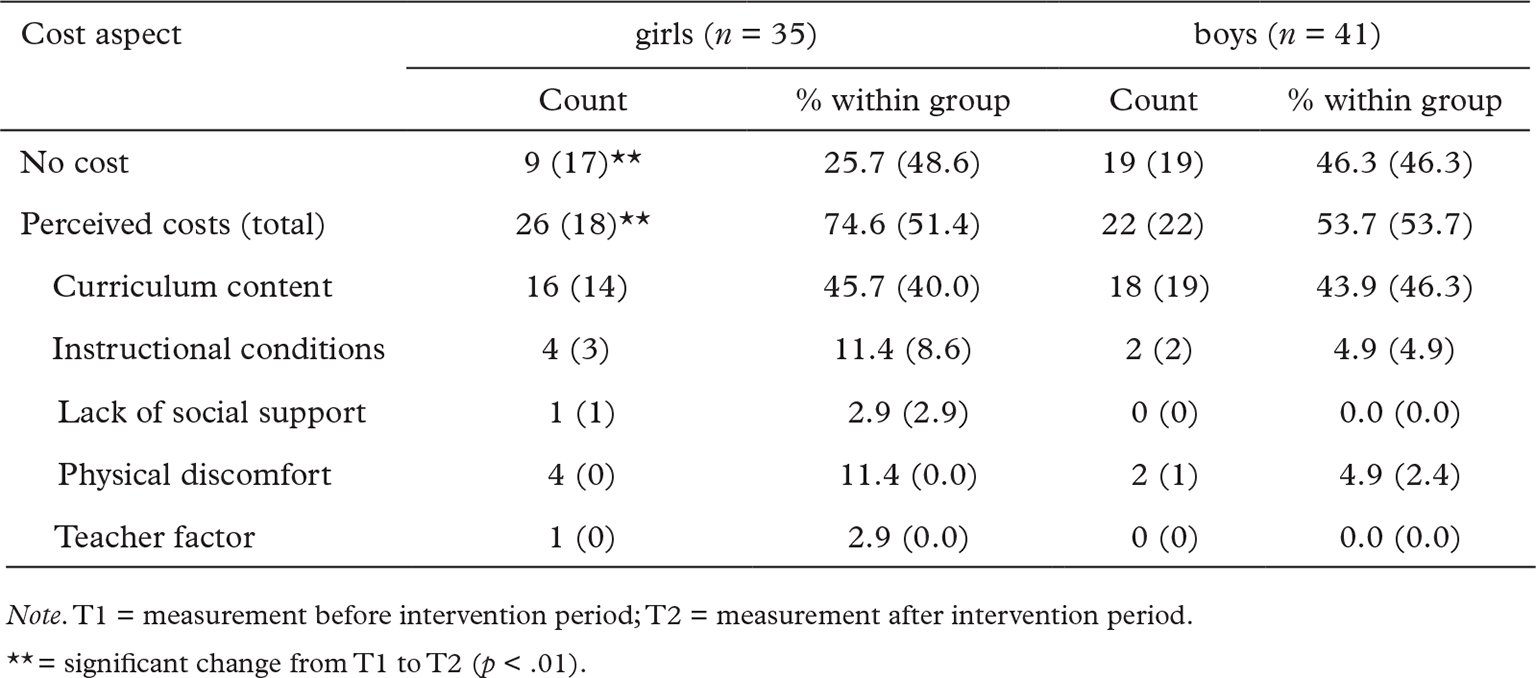
The Friedman’s test indicated that within the intervention group, the girls (χ2(1) = 8.00, p = .005) and boys (χ2(1) = .000, p = 1.000) rated Q1 differently from T1 to T2.
Table 3 presents the results of Q2.
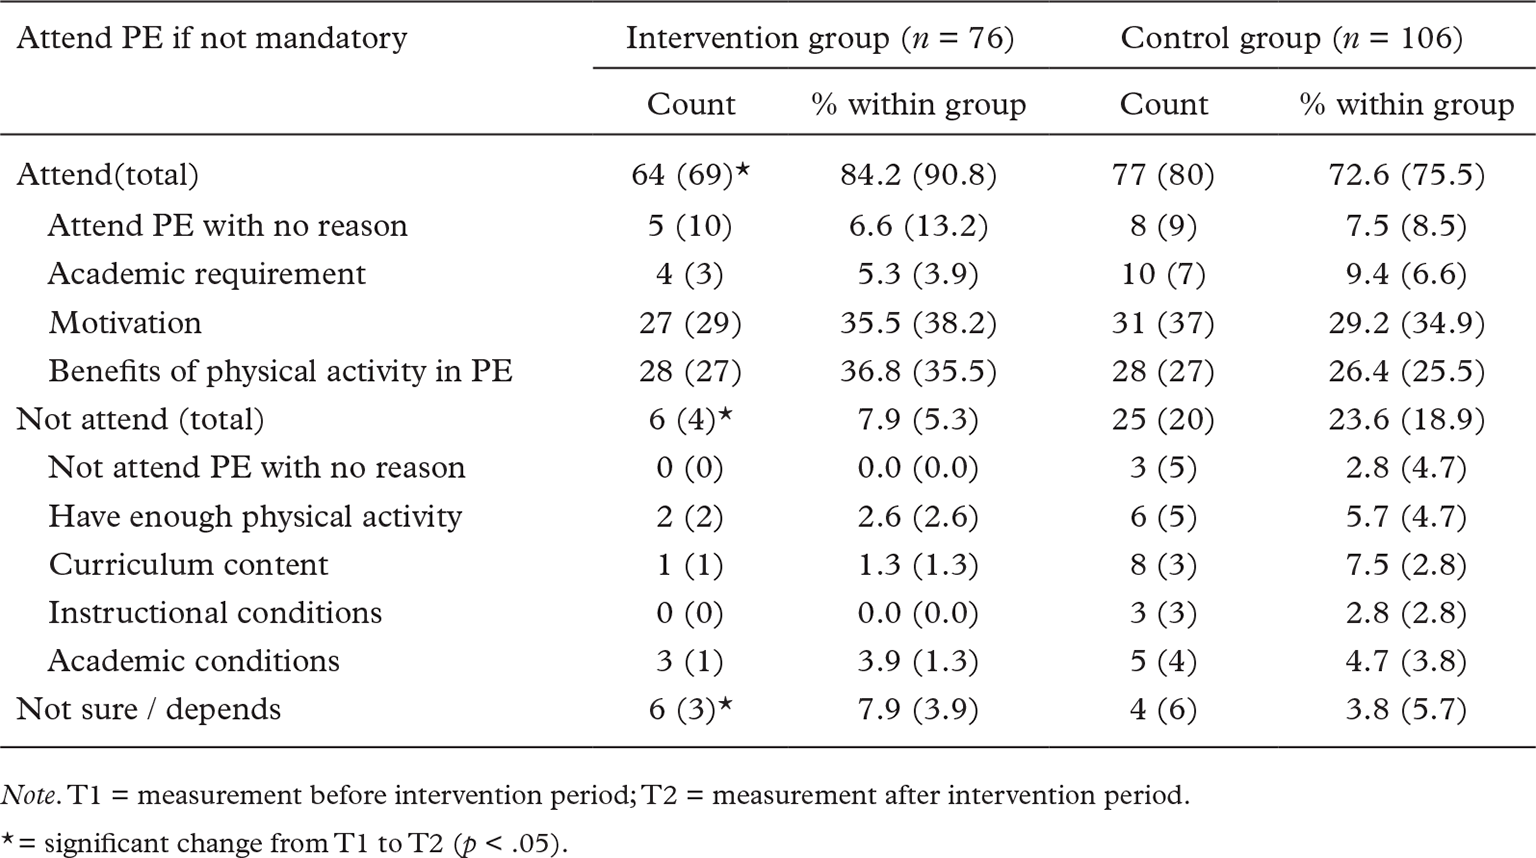
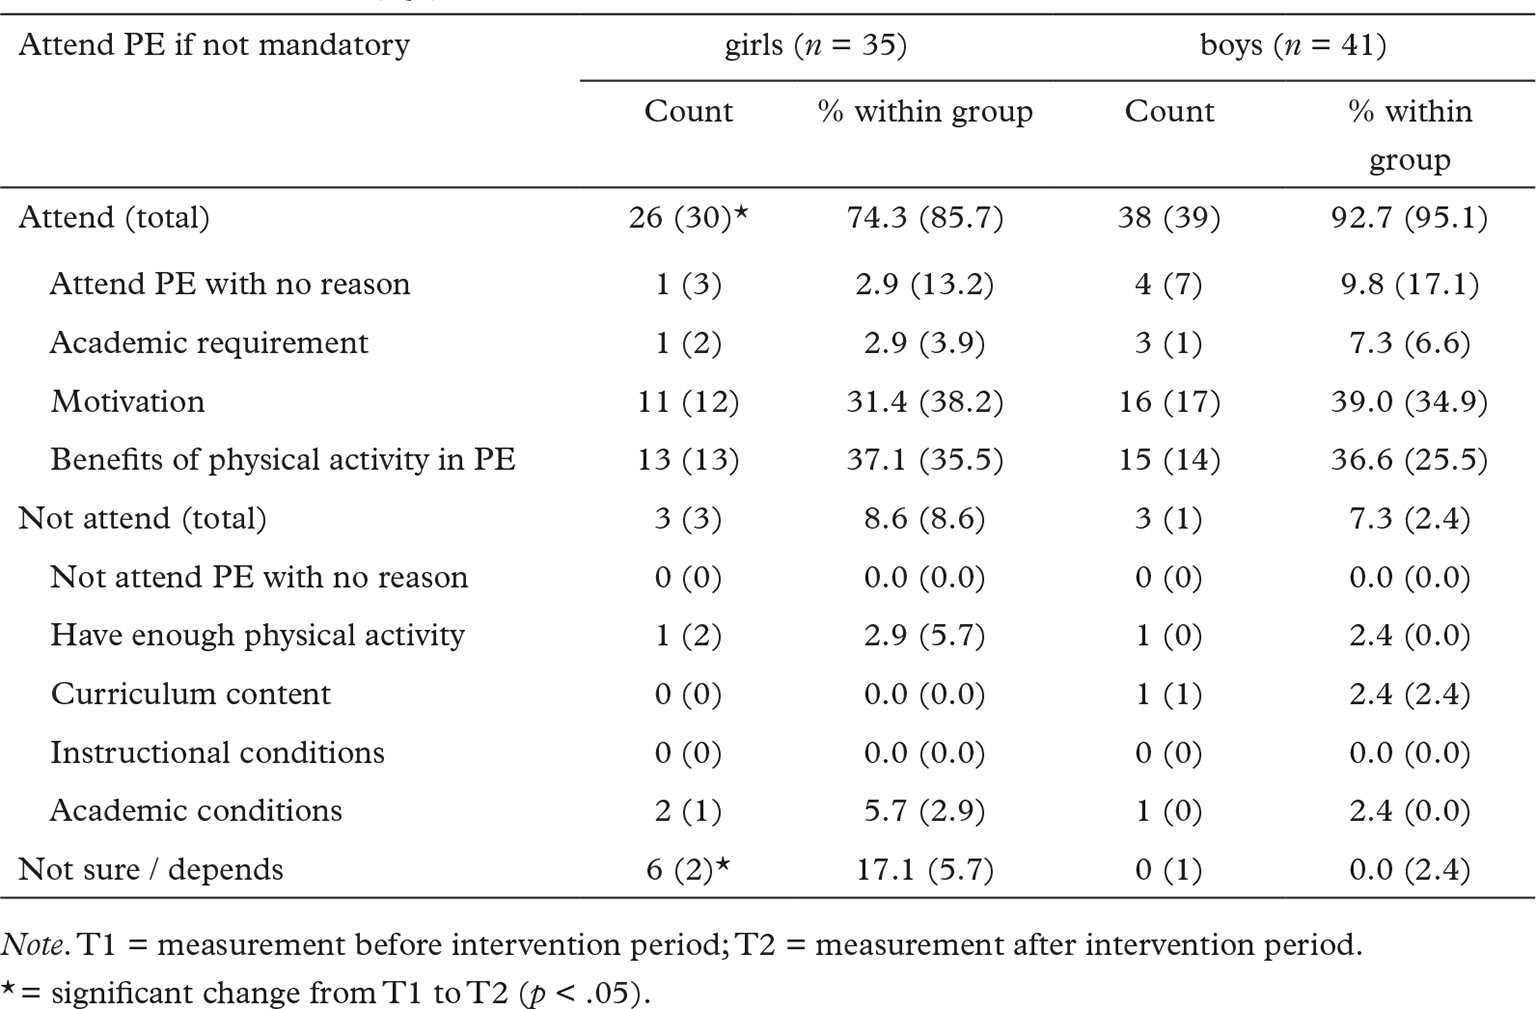
The Friedman’s test indicated that the intervention group (χ2(1) = 4.50, p = .034) and the control group (χ2(1) = .077, p = .782) rated Q2 differently from T1 to T2. The gender differences within the intervention group are presented in Table 4.
The Friedman’s test indicated that within the intervention group, the girls (χ2(1) = 5.00, p = .025) and boys (χ2(1) = .333, p = .564) rated Q2 differently from T1 to T2.
Because several studies have found that motivation declines with age, age was also tested in terms of its relationship to the perceived costs of and intention to participate in PE (both at T1). The results of a Pearson correlation coefficient test (two-tailed, pairwise exclusion) showed that age correlated with perceived costs (Q1) (n = 252, r = .140, p = .026) and with the intention to participate in PE (Q2) (n = 287, r = .190, p < .001). Neither of the correlations were strong. When controlling for gender, the results of Q1 were as follows: girls (n = 122, r = .100, p = .274) and boys (n = 130, r = .164, p = .062). When controlling for gender, the results of Q2 were as follows: girls (n = 139, r = .218, p = .010) and boys (n = 148, r = .095, p = .249). These analyses included all students who answered Q1, Q2 or both, independent of belonging to the intervention group or the control group.
A chi-square test was used to demonstrate whether there was an association between cost aspects and subsequent hypothetical choices at T1. The result of the chi-square analysis revealed that the association between these two variables was statistically significant (n = 249, χ2(2) = 16.13, p < .001), which suggested that adolescents’ cost aspects were associated with their hypothetical choices. A medium Cramer’s V effect size of .255 was estimated (Cohen, 1988). The adolescents who reported no motivational cost were more likely to choose to attend PE than those who reported a motivational cost. When comparing genders, more than 20 % of the expected counts were less than five, and the test could not be used. These analyses included all students who answered Q1, Q2 or both, independent of belonging to the intervention group or the control group.
Discussion
The answers to Q1 revealed what aspects of PE the students did not like and thus the costs of attending PE. Table 3 shows that FL significantly reduces the perceived costs of attending PE. Table 4 shows that the difference between the intervention group and the control group is due to gender. Compared to the boys, the girls perceived significantly less costs in attending PE after three lessons in which FL was used as a method, whereas no differences were observed among the boys.
About 45% of all students reported that “curriculum content” was the perceived cost of attending PE. This percentage was similar among all the students and did not change significantly from T1 to T2. A comparable distribution of perceived costs of attending PE is also found in previous studies among Norwegian adolescents (Säfvenbom et al., 2014), students in U.S. elementary schools (A. Chen et al., 2008), students in U.S. middle schools (Zhu & Chen, 2013) and Chinese college students (A. Chen & Liu, 2009).
Q2 revealed whether the students experienced opportunity cost in attending PE, as PE was a mandatory subject. Table 5 shows that FL significantly increases the number of students who would attend PE if given the choice. Table 6 shows that this difference is due to girls and their shift from “not sure/it depends” to “attend PE.” There is a minor, positive change among boys as well, but this change is not significant.
So, why do girls perceive significantly less costs in attending PE when the class content is delivered as FL compared to boys, and why do boys not report the same change? “Physical discomfort” was one category that was reported less at T2 than T1, both for the intervention group and the control group. This shows that the practical lessons in this project were somewhat different from their normal class content. Among boys in the intervention group, responses to the category “physical discomfort” went from two counts to one count, but among girls in the intervention group, this went from four counts to zero counts. One possible answer to why the perceived costs of attending PE are less when the class content is delivered as FL may be that students tend to be more motivated when they understand why the learning activities are conducted and when they understand the context, as shown by Ryan and Deci (2000) and Skaalvik and Skaalvik (2015). The control group performed the exact same activities but did not demonstrate a significant change in counts. This view is also supported by Moen et al. (2018), who found that a representative selection of Norwegian primary school students wanted the PE teachers to ask more questions, the PE classes to have more opportunity for discussion and the curriculum content to focus on knowledge development.
Considering that curriculum content produces the most negative feelings towards PE, FL can provide meaning to the activities to enhance their relevance and to increase students’, especially girls’, motivation to engage with the content. Responses to Q1 in the category of “physical discomfort” included “we have to be outside when it is cold,” “I don’t like running because I have trouble with my legs” and “I don’t like that it hurts when we do exercises, but if we do then it will get better.” These responses indicated dissatisfaction with the activities in terms of the weather, the type of activity and where the activity was conducted. Hence, the perceived costs mainly stemmed from the class content. It seems that variation and more information and knowledge about the practical activities can lower the perceived sensation of physical discomfort and thus reduce the costs of attending PE. Out of these factors, FL can contribute with information and knowledge, while the PE teachers must take responsibility for providing variation. But if teachers start exploring new teaching methods, this alone will create more reflection on and consciousness of the curriculum and class content. Several researchers suggest a more holistic approach to teaching in PE (Dyson, 2014; Ennis, 2011), and teachers who use a wide range of learning methods tend to motivate students to participate in PE more than teachers who use limited learning methods (Dyson, 2014; Moen & Green, 2012).
This study supports earlier studies in which PE was found to present challenges in terms of class content and teaching methods (e.g. Moen et al., 2018) but not that the class content was more beneficial for boys than for girls (e.g. Engelsrud, 2015), as both boys and girls had the same distribution regarding the perceived costs of attending PE lessons. Nevertheless, PE teachers must reflect more upon the content applied to practical classes, as the perceived cost of attending PE is mostly the result of the content and is not due to other factors, such as peers and teacher-student relationships. As suggested by Moen et al. (2018), it seems that PE has not become less “sportified” than it was before.
PE teachers must be aware of the gender differences in PE considering that girls receive lower marks in PE than boys (Statistics Norway, 2017) and have a less positive attitude towards PE than boys (Säfvenbom et al., 2014). There is clear evidence that FL, if conducted in a similar way to that done in this study, can have a significant, positive impact on adolescents’, especially girls’, perceived costs of attending PE. The responses to the open-ended questions and the results presented in Tables 3 and 4 must be juxtaposed with earlier findings demonstrating that FL significantly affects girls’ expectancy beliefs and attainment value in PE (Østerlie, 2018). As the value of attending PE increases and expectancy beliefs increase, less costs are perceived. This assumption is also observed in academic settings, such as reading. The more explicitly the values of an assignment are explained, the more likely students will become engaged in the assignment and remain motivated to continue studying in the content area (Paris, Lipson, & Wixson, 1983; Wigfield, 2000). These findings provide empirical evidence for the demonstrated theoretical coherence of adolescents’ motivation to participate in PE according to expectancy-value motivation, which suggests that expectancy beliefs and subjective task values work in the opposite direction of perceived costs when motivation is changing (Eccles & Wigfield, 2002).
This study found that the majority of adolescents would attend PE if given the choice, despite their perceived costs of attending. About 65% of adolescents reported perceived costs in attending, but only about 21% indicated that they would not attend PE if given the choice. Chen et al. (2009; 2008) found the same among college PE students and PE students in elementary school, suggesting that the strong, positive values of physical activity override the effect of cost. Thirty-five percent of adolescents reported no negative perceptions of PE, suggesting that it is one of the most-liked subjects in school, as this percentage was even higher than that found in other studies (Zhu & Chen, 2013).
This study shows that adolescents who report perceptions of cost in attending PE are more likely to not want to attend PE lessons. The same association is observed among younger students (Zhu & Chen, 2013), but not among college students (A. Chen & Liu, 2009). Several researchers have shown that both internationally (e.g. Gao et al., 2008) and in Norway (Moen et al., 2018), the motivation to participate in PE declines with age. This study confirms this by demonstrating how the perceived costs of attending PE increase with age and the intention to participate in PE declines with age. Both girls and boys report an increase in perceived costs as they get older, but these costs have a different effect on girls than on boys regarding the hypothetical choice of participating in PE. It would be important to investigate these gender differences further. Nevertheless, age predicts a motivational decline among young people, and this study shows that FL can be an important contributor to decelerate motivational loss, especially among girls.
Strengths and Limitations
The sample used in this study represents a diversity of locations in urban and rural areas and thus reflects the general adolescent population in Norway. Moreover, the students’ semester marks in PE corresponded with the national average grade for the actual semester, which indicated that the present sample did not differ from the general population of Norwegian adolescents. The PE teachers administered the data collection at the beginning of a PE lesson, thus ensuring anonymity and ensuring that students had enough time to complete the questionnaire. This procedure of using a well-known teacher in familiar surroundings contributed to the students feeling comfortable in the assessment situation, which helped to generate reliable data.
Despite its strengths, the study has some limitations. First, the study included adolescents who were 13–17 years old. Thus, the present results cannot be generalized to younger children nor to older adolescents. Second, the intervention period only included three sessions. Third, as there is no framework on how FL should be conducted in PE, these results must be interpreted considering the research design. Hence, the generalisability of the results of the study are limited if later FL designs in PE differ from the design in this study.
Conclusions
This study shows that FL lowers adolescents’ perceived costs of attending PE. Thus, FL positively affects adolescents’ motivation to participate in PE. As discussed, FL seems to benefit girls more than boys in a PE setting, and hence can reduce the gender differences found in PE. This study shows that adolescents who report perceived costs of attending PE are more likely to not want to attend the subject and further that the perceived costs of attending PE increase with age and the intention to participate in PE declines with age.
The present study provides further evidence that class content remains a challenge in PE, as the adolescents reported curriculum content as the biggest contributor to their perceived costs of attending PE. Nevertheless, most of the students indicated that they would attend PE if the subject were optional, despite the costs they perceived in attending. Overall, the results suggest that teachers must design curriculum content that not only physically engages the students but also demands higher-order cognitive processes to maintain adolescents’ motivation to attend PE. To achieve this end, FL can be used.
Future research should identify and examine best FL practices in PE, including a framework for FL use, and determine how FL and gender differences affect the motivation and intention to participate in PE among both younger children and older adolescents.
Acknowledgements
I would like to acknowledge the generous help of the participating children and all the school staff in conducting the classes and collecting the data involved in this study.
References
- Akçayır, G., & Akçayır, M. (2018). The flipped classroom: A review of its advantages and challenges. Computers & Education, 126, 334–345. https://doi.org/10.1016/j.compedu.2018.07.021
- Andrews, T., & Johansen, V. (2005). Gym er det faget jeg hater mest. Norsk pedagogisk tidsskrift, 89(04), 302–314.
- Aune, T. K., Pedersen, A. V., Ingvaldsen, R. P., & Dalen, T. (2017). Relative age effect and gender differences in physical education attainment in Norwegian schoolchildren. Scandinavian Journal of Educational Research, 61(3), 369–375. https://doi.org/10.1080/00313831.2016.1148073
- Bergmann, J., & Sams, A. (2014). Flipped learning: Gateway to student engagement. Eugene, Or: International Society for Technology in Education.
- Bing, Z. (2017). A survey analysis of the network flipped classroom model application in the optimization of the university physical education classroom system. Boletín Técnico, 55(19), 413–418.
- Chen, A., & Liu, X. (2009). Task values, cost, and choice decisions in college physical education. Journal of Teaching in Physical Education, 28(2), 192–213.
- Chen, A., Martin, R., Ennis, C. D., & Sun, H. (2008). Content specificity of expectancy beliefs and task values in elementary physical education. Research Quarterly for Exercise and Sport, 79(2), 195–208. https://doi.org/10.1080/02701367.2008.10599483
- Chen, L. L. (2016). Impacts of flipped classroom in high school health education. Journal of Educational Technology Systems, 44(4), 411–420. https://doi.org/10.1177/0047239515626371
- Cohen, J. (1988). Statistical power analysis for the behavioral sciences (2nd ed.). Hillsdale, N. J: Laurence Erlbaum.
- Dowling, F. (2016). De idrettsflinkes arena : Ungdoms fortellinger fra kroppsøvingsfaget med blikk på sosial klasse. In Ø. Seippel, M. K. Sisjord, & Å. Strandbu (Eds.), Ungdom og Idrett (pp. 249–268). Oslo: Cappelen Damm Akademisk.
- Dyson, B. (2014). Quality physical education: A commentary on effective physical education teaching. Research Quarterly for Exercise and Sport, 85(2), 144–152. https://doi.org/10.1080/02701367.2014.904155
- Eccles, J. S. (1983). Expectancies, values, and academic behaviors. In J. T. Spence (Ed.), Achievement and achievement motives : Psychological and sociological approaches (pp. 70–146). San Francisco, CA: Freeman.
- Eccles, J. S., & Wigfield, A. (1995). In the mind of the actor: The structure of adolescent achievement task values and expectancy-related beliefs. Personality and Social Psychology Bulletin, 21(3), 215–225.
- Eccles, J. S., & Wigfield, A. (2002). Motivational beliefs, values, and goals. Annual review of psychology, 53, 109–132.
- Engelsrud, G. (2015). Kjønn og inkludering. In Ø. F. Standal & G. Rugseth (Eds.), Inkluderende kroppsøving (pp. 24–43). Oslo, Norway: Cappelen Damm Akademisk.
- Ennis, C. D. (1999). Creating a culturally relevant curriculum for disengaged girls. Sport, Education and Society, 4(1), 31–49. https://doi.org/10.1080/1357332990040103
- Ennis, C. D. (2011). Physical education curriculum priorities: Evidence for education and skillfulness. Quest, 63(1), 5–18. https://doi.org/10.1080/00336297.2011.10483659
- Flipped Learning Network [FLN]. (2014). Definition of flipped learning. Retrieved from http://flippedlearning.org/domain/46
- Fredricks, J. A., & Eccles, J. S. (2002). Children’s competence and value beliefs from childhood through adolescence: Growth trajectories in two male-sex-typed domains. Developmental psychology, 38(4), 519–533. https://doi.org/10.1037//0012-1649.38.4.519
- Frydenberg, M. (2012). Flipping excel. Paper presented at the Information Systems Educators Conference, New Orleans Louisiana, USA.
- Gao, Z. (2009). Students’ motivation, engagement, satisfaction, and cardiorespiratory fitness in physical education. Journal of Applied Sport Psychology, 21, S102–S115. https://doi.org/10.1080/10413200802582789
- Gao, Z., Lee, A. M., & Harrison, L., Jr. (2008). Understanding students’ motivation in sport and physical education: From the expectancy-value model and self-efficacy theory perspectives. Quest, 60(2), 236–254. https://doi.org/10.1080/00336297.2008.10483579
- García, I. G., Castro, L. N., & Morales, P. T. (2015). Las flipped classroom a través del smartphone: Efectos de su experimentación en educación física secundaria. Prisma Social: revista de ciencias sociales(15), 296–351.
- Goodlad, J. I. (2004). A place called school: Twentieth anniversary edition. New York, NY: McGraw-Hill.
- Green, K. (2008). Understanding physical education. London: Sage.
- Gustavsen, A., & Strømsvik, C. L. (2018). «Den viktigste faktoren er hverandre!» Sluttrapport fra prosjektet «Mer fysisk aktive elever i skolen». (NF rapport nr.: 1/2018). Retrieved from http://www.nordlandsforskning.no/getfile.php/1321329/Dokumenter/Rapporter/1018/NF%201_2018%20Det%20viktigste%20er%20hverandre.pdf.
- Killian, C. M., Trendowski, T. N., & Woods, A. M. (2016). Students’ perceptions of flipped instruction in a university physical activity course. Paper presented at the 2016 AIESEP International Conference, Laramie, WY, USA.
- Kirk, D. (2010). Physical education futures. London, UK: Routledge.
- Kjønniksen, L., Fjørtoft, I., & Wold, B. (2009). Attitude to physical education and participation in organized youth sports during adolescence related to physical activity in young adulthood: A 10-year longitudinal study. European Physical Education Review, 15(2), 139–154. https://doi.org/10.1177/1356336X09345231
- Lagestad, P. (2017). Er gutter bedre enn jenter i kroppsøving?-En studie av jenter og gutters kroppsøvingskarakterer i den videregående skolen. Acta Didactica Norge, 11(1), 1–21
- Lina, Z. (2017). A improved method for teaching system innovation design of physical education major in colleges based on flipped classroom. Revista de la Facultad de Ingeniería, 32(9), 630–635.
- Long, T., Logan, J., & Waugh, M. (2016). Students’ perceptions of the value of using videos as a pre-class learning experience in the flipped classroom. TechTrends, 60, 245–252. https://doi.org/10.1007/s11528-016-0045-4
- Lundvall, S. (2016). Approaching a gender neutral PE-culture? An exploration of the phase of a divergent PE-culture. Sport in Society, 19(5), 640–652. https://doi.org/10.1080/17430437.2015.1073944
- Missildine, K., Fountain, R., Summers, L., & Gosselin, K. (2013). Flipping the classroom to improve student performance and satisfaction. Journal of Nursing Education, 52(10), 597–599. https://doi.org/10.3928/01484834-20130919-03
- Moen, K. M., & Green, K. S. (2012). Physical education teacher education in Norway: The perceptions of student teachers. Sport, Education and Society, 19(6), 806–823. https://doi.org/10.1080/13573322.2012.719867
- Moen, K. M., Westlie, K., Bjørke, L., & Brattli, V. H. (2018). Physical education between ambition and tradition: National survey on physical education in primary school in Norway (Grade 5–10). (1). Retrieved from https://brage.bibsys.no/xmlui/handle/11250/2482450.
- Oliver, K. L., & Kirk, D. (2015). Girls, gender and physical education: An activist approach. London, UK: Routledge.
- Paris, S. G., Lipson, M. Y., & Wixson, K. K. (1983). Becoming a strategic reader. Contemporary Educational Psychology, 8(3), 293–316.
- Ryan, R. M., & Deci, E. L. (2000). Intrinsic and extrinsic motivations: Classic definitions and new directions. Contemporary Educational Psychology, 25, 54–67. https://doi.org/10.1006/ceps.1999.1020
- Scraton, S. (2013). Feminism and physical education: Does gender still matter. In G. Pfister & M. K. Sisjord (Eds.), Gender and sport. Changes and challenges (pp. 199–216). Münster, DE: Waxmann Verlag.
- Shen, B. (2014). Outside-school physical activity participation and motivation in physical education. British Journal of Educational Psychology, 84, 40–57. https://doi.org/10.1111/bjep.12004
- Skaalvik, E. M., & Skaalvik, S. (2015). Motivasjon for læring: Teori og praksis. Oslo: Universitetsforlaget.
- Statistics Norway. (2016). Marks, lower secondary school, 2016. Retrieved from https://www.ssb.no/en/utdanning/statistikker/kargrs
- Statistics Norway. (2017). Marks, lower secondary school, 2017. Retrieved from https://www.ssb.no/en/utdanning/statistikker/kargrs
- Strauss, A. L., & Corbin, J. M. (1998). Basics of qualitative research: Techniques and procedures for developing grounded theory. Thousand Oaks, CA: Sage.
- Säfvenbom, R., Haugen, T., & Bulie, M. (2014). Attitudes toward and motivation for PE: Who collects the benefits of the subject? Physical Education and Sport Pedagogy, 20(6), 629–646. https://doi.org/10.1080/17408989.2014.892063
- Thomas, K. T., Lee, A. M., & Thomas, J. R. (2008). Physical education methods for elementary teachers (3rd ed.). Champaign, IL: Human Kinetics.
- Vlieghe, J. (2013). Physical education beyond sportification and biopolitics: An untimely defense of Swedish gymnastics. Sport, Education and Society, 18(3), 277–291. https://doi.org/10.1080/13573322.2011.566602
- Wake, M. (2018). The failure of anti-obesity programmes in schools. British Medical Journal Publishing Group. https://doi.org/10.1136/bmj.k507
- Walseth, K., Engebretsen, B., & Elvebakk, L. (2018). Meaningful experiences in PE for all students: An activist research approach. Physical Education and Sport Pedagogy, 1–15. https://doi.org/10.1080/17408989.2018.1429590
- Wigfield, A. (1994). Expectancy-value theory of achievement motivation: A developmental perspective. Educational Psychology Review, 6(1), 49–78. https://doi.org/10.1007/bf02209024
- Wigfield, A. (2000). Facilitating children’s reading motivation. In L. Baker, M.J. Dreher, & J.T. Guthrie (Eds.), Engaging young readers: Promoting achievement and motivation (pp. 140–158). New York, NY: Guilford Press.
- Wigfield, A., & Eccles, J. S. (2000). Expectancy–value theory of achievement motivation. Contemporary Educational Psychology, 25, 68–81. https://doi.org/10.1006/ceps.1999.1015
- Xiang, P., McBride, R., & Bruene, A. (2004). Fourth graders’ motivation in an elementary physical education running program. Elementary School Journal, 104(3), 253–266. https://doi.org/10.1086/499752
- Xiang, P., McBride, R., & Bruene, A. (2006). Fourth-grade students’ motivational changes in an elementary physical education running program. Research Quarterly for Exercise and Sport, 77, 195–207. https://doi.org/10.1080/02701367.2006.10599354
- Xiang, P., McBride, R., Guan, J., & Solmon, M. (2003). Children’s motivation in elementary physical education: An expectancy-value model of achievement choice. Research Quarterly for Exercise and Sport, 74, 25–35. https://doi.org/10.1080/02701367.2003.10609061
- Zhu, X., & Chen, A. (2010). Adolescent expectancy-value motivation and learning: A disconnected case in physical education. Learning and Individual Differences, 20, 512–516. https://doi.org/10.1016/j.lindif.2010.04.013
- Zhu, X., & Chen, A. (2013). Motivational cost aspects of physical education in middle school students. Educational Psychology, 33(4), 465–481. https://doi.org/10.1080/01443410.2013.785043
- Zhu, X., Sun, H., Chen, A., & Ennis, C. (2012). Measurement invariance of expectancy-value questionnaire in physical education. Measurement in Physical Education and Exercise Science, 16(1), 41–54. https://doi.org/10.1080/1091367X.2012.639629
- Østerlie, O. (2016). Flipped learning in physical education: Why and how? In D. Novak, B. Antala, & D. Knjaz (Eds.), Physical education and new technologies (pp. 166–176). Zagreb: Croatian Kinesiology Association.
- Østerlie, O. (2018). Can flipped learning enhance adolescents’ motivation in physical education? An intervention study. Journal for Research in Arts and Sports Education, 2, 1–15. https://doi.org/10.23865/jased.v2.916